By Patrick Perry and Keith Reigert, NYU Stern School of Business
Originally posted on Medium.
A lot of people at Stern are angry about the data collection error that caused the school’s U.S. News and World Report full-time MBA program ranking to drop from #11 last year to #20 this year. Stern failed to report the number of students that submitted GMAT scores to the school, and rather than alert the school to this omission, U.S. News chose to estimate the missing value. Some forensic data analysis, shows that the omission caused U.S. News to effectively replace Stern’s average GMAT score (720) with a much lower value (560). We don’t definitively know that this is what happened, but the evidence is compelling.
The missing-data debacle got us interested more generally about how business school rankings are determined in the first place. U.S. News describes the process on their website. They measure a set of eight attributes for each school and then reduce these eight values to a single numerical score by taking a weighted combination. Some people have taken issue with the sensitivity of rankings to the specific choices of weights used to combine the individual attributes. These critics certainly have a point, but to us, the more fundamental issue is that many of the measurements that U.S. News uses to rank business schools are themselves problematic.
While attributes like “Mean Starting Salary” and “Mean Undergraduate GPA” are, without a doubt, useful for prospective students deciding whether to apply to a school (and for assessing their chances of being accepted), these attributes may not have much to say about the quality of a school itself. Here is a breakdown of some of the specific measurement issues we see:
- Mean Starting Salary, a measure of the mean salary of students entering the workforce after graduation, is informative for students considering the return on investment of attending a certain school, but it tends to be more a function of geography and student career choice than school quality.
- Employment Rate at Graduation and Employment Rate Three Months After Graduation, again are informative and relevant for students considering a program’s return on investment, but they have little bearing on the value of the school. Furthermore, at a time when many of the nation’s top schools are fostering innovation and entrepreneurship programs (straying from the traditional “corporate recruiting model” of MBA programs), these attributes may be outdated.
- Mean Undergraduate GPA is not comparable across different applicant pools (a 3.0 GPA from Harvard doesn’t mean the same thing as a 3.0 GPA from DeVry).
- Acceptance Rate is not comparable for schools with different enrollments (Harvard enrolls roughly 1900 students; Stanford enrolls 800; Haas enrolls 500). Furthermore, shifting national trends in the number and quantity of business school applications each year can have varying affects on schools, unrelated to school quality (for example, over the past few years, there has been a national decline in the number of applicants to part-time MBA programs, but schools located in or near Silicon Valley have been less affected by this trend).
It’s likely that U.S. News tries to adjust these measurements to fix some of the issues mentioned above, but it is not clear how they are doing this or how effective these adjustments are.
For ranking the “best” business schools, there are three attributes that, while by no means perfect, seem to be more trustworthy:
- Mean GMAT Score measures the quality of the student body at the start of the MBA. This also quantifies the perceived value of the school to each year’s incoming class (the higher a student’s GMAT score, the more potential program options they have for getting their MBA).
- Peer Assessment Score and Recruiter Assessment Score both measure the quality of the student body at the end of the MBA. The former is based on business school deans’ ratings of their competitors, and the latter is based on corporate recruiters’ and company contacts’ assessments.
We don’t have much insight into the different psychologies of business school deans and corporate recruiters, but empirically, “Peer Assessment” and “Recruiter Assessment” are strongly correlated with each other (correlation 0.83) and it seems to us like these numbers are two different measurements of the same attribute. To combine both into a single “Combined Assessment Score”, we standardize each to have the same standard deviation and take the average of the two numbers. To make the result more interpretable, we transform back to the original 1–5 scale; this effectively puts a weight of 45% on peer assessment and 55% on recruiter assessment.
Here’s a scatter plot of the “Mean GMAT Score” and “Combined Assessment Score” for the ranked U.S. News business schools. Each point represents a school, with the x and y coordinates giving the respective attribute values. (Three schools have average GMAT scores below 600, and they have been excluded from this plot.)
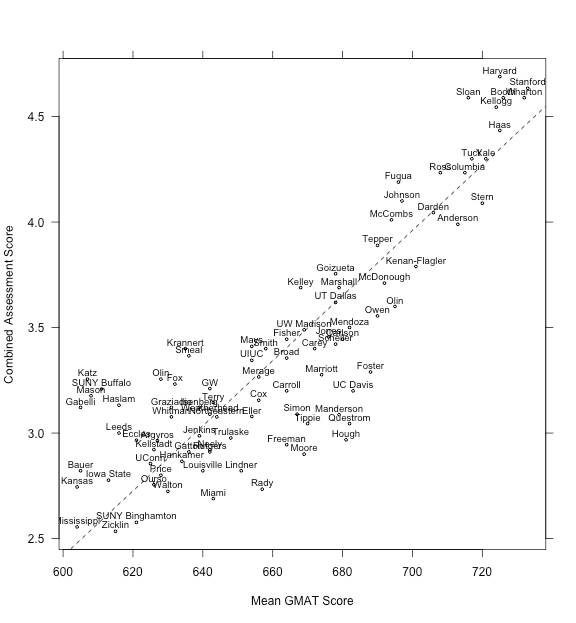
If we want to use these two attributes to rank the schools, there is a natural choice, which is to rescale the attributes appropriately and then give each equal weight. (This process has a geometric interpretation, which is that each point in the scatter plot gets mapped to the closest spot on the dashed line, preserving as much of the variability in the data as possible.)
Rescaling is necessary because GMAT scores (ranging from 200–800) are not directly comparable to assessment scores (ranging from 1–5). To make the values comparable, we subtract off the mean of each attribute and divide by its standard deviation. This ensures that each rescaled attribute has mean 0 and standard deviation 1. We then give each rescaled attribute a weight of 50%. To make the values more interpretable, after we compute the scores, we re-center and rescale them to have mean 75 and standard deviation 10, then round the values. The rounding process induces some ties between schools, but otherwise this transformation does not affect the final ranking.
The final formula for determining a school’s score is
(Simplified Score) = -39.14 + 0.125 (Mean GMAT) + 4.26 (Peer Assessment) + 5.28 (Recruiter Assessment)
The following table shows the rank and score for the top 30 schools as determined by this simplified method. We’ve also included the mean GMAT scores, the assessment scores, and the aggregate scores and rankings as reported by U.S. News.
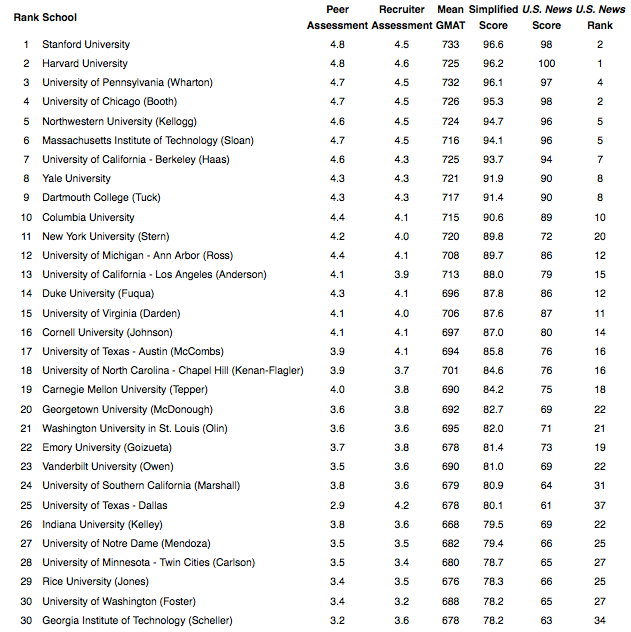
The simplified GMAT/assessment ranking method gives reasonable results, comparable to U.S. News in most cases. The U.S. News ranking method is much more complicated. Which ranking is better? We’re obviously biased, but in this situation, like in most other situations, we prefer the simpler method. With the U.S. News system, we have concerns about many of the inputs, and we don’t have much confidence in the weights used to compute the final scores. With the simplified method based on GMAT and assessment, we have confidence in all of the inputs and we can understand how they relate to the final score.
Patrick Perry (@ptrckprry) is an Assistant Professor of Information, Operations, and Management Sciences at NYU Stern.
Keith Reigert (@KeithRiegert) is an MBA candidate at NYU Stern and an editor at the Stern Opportunity.
The raw data used to compute the rankings, was originally collected and reported by U.S. News. The plot and the table in this article were produced using the R software environment. The data and source code are available for download.
Appendix
To validate our intuition that many of the factors used in the U.S. News ranking are poor proxies for school quality, we looked at scatter plots of all seven attributes versus the schools’ mean GMAT scores. In these plots, each point represents a school.
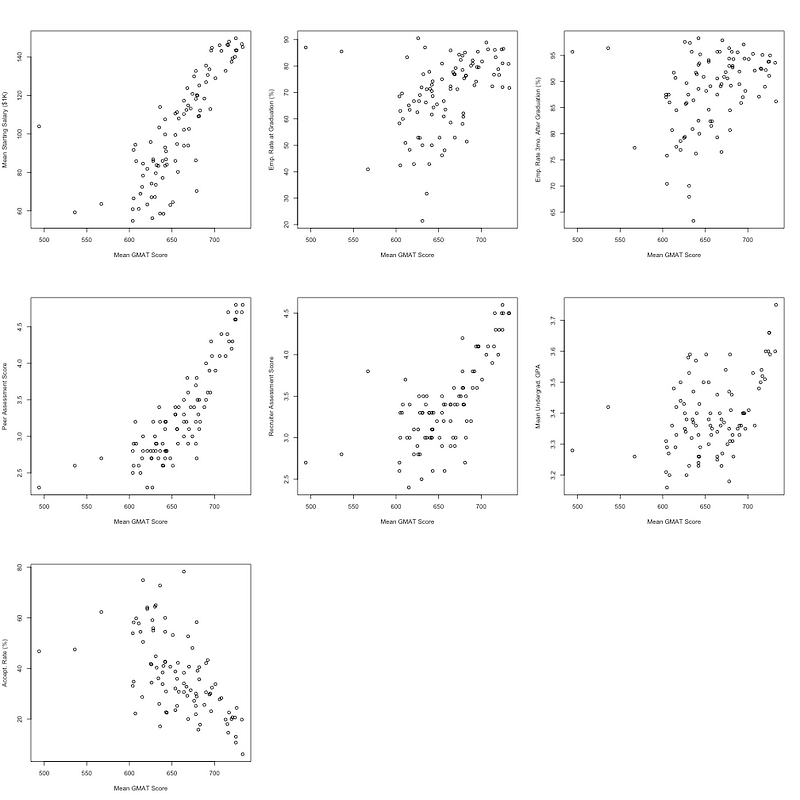
From these plots, it is clear that “Employment Rate at Graduation”, “Employment Rate Three Months After Graduation”, “Mean Undergraduate GPA”, and “Acceptance Rate” are poor measures of school quality in that they appear only slightly related to “Mean GMAT Score” (arguably the most reliable measure of school quality).
Despite its strong relationship with “Mean GMAT Score”, we still feel uncomfortable including “Mean Starting Salary” as a ranking factor due to its strong dependence on geography (the highest quality schools tend to be located in cities with high-paying jobs).